2021
Hunger
Report
Prepared by Robin Bailey
and Jennifer Siekiel
About the Burlington Food Bank
About the Authors

Robin Bailey
Executive Director, Burlington Food Bank
Robin Bailey started with the Burlington Food Bank as the Executive Director in August of 2017. He previously served the community of Burlington for approximately 7.5 years with the Salvation Army Family Services administering their programming.
As the Executive Director of the Burlington Food Bank, he takes great pride in the staff and volunteers dedication, service and deep care for our clients.
He also serves with Feed Ontario as a Director and a team member on their Advocacy Committee, as well as a number of other local initiatives and committees

Jennifer Siekiel
Research Assitant, McMaster University
About This Report
Food insecurity is when enough nutritious food is not reliably accessible due to financial challenges that individuals or households experience. Food banks are typically not-for-profit organizations, not funded by the government, with the mission to provide access to nutritious food on a consistent basis to those who seek assistance.
In the summer of 2021, the Burlington Food Bank conducted surveys to get a better look into the experience of its clients. The Link2Feed system collects information about the demographics of clients, however, the lifestyle of clients is not explicitly shown. Some of the survey responses developed trends that are outlined throughout this report, and some have connections to the Feed Ontario Hunger Reports of 2020 and 2021.
The need in Burlington is significant, despite the affluence commonly associated with the city’s population. This report allows us to see the need here in Burlington, specifically in regard to those using the Burlington Food Bank as a source in dealing with their struggle with food insecurity.
Executive Summary
DATA TRENDS
Increase of Clients Since 2019
After the pandemic started mid-March in 2020, the number of clients accessing Food Bank services increased by over 62%. The UIS in 2020 increased to 3,081 and those individuals made a total of 14,636 visits and though the UIS in 2021 stayed level with 2020 numbers the total number of visits increased to 17,581.
As shown in the graph (page 9), in 2021, those numbers have not gone down, and the lasting financial effects of the pandemic are still impacting clients. The Feed Ontario Hunger Report of 2021 supports these results saying that, “an analysis of recent food bank visits [show] that the trend of increasing food bank use is not reversing” (King, Quan, Ward-Beveridge, Dixon, & Cheng, 2021).
There is a continuous need for assistance that was relieved for a time via the Canada Emergency Response Benefit (CERB), but requires more attention through policy and government action.

DATA TRENDS
Inadequate Social Support
Those on OW are in an even more tenuous situation in regard to their finances. A household consisting of 2 adults and one child under 17 receives $1191 per month and a household consisting of 2 adults and a child or dependent 18 or over would receive the maximum allowable from OW which is $1349 per month (City of Toronto, 2018).
Note: “Living Wage” is calculated, exclusively based on a weighted average across the needs of a family of 4, a single parent and a single adult. Living wage includes shelter, food, clothing, medical expenses, childcare, transportation, recreation, and a modest vacation. The calculation excludes things like debt repayment, savings for retirement, savings for children’s future education, or homeownership.
Do these monthly amounts measure up to the minimum financial requirements for living in the Halton Region? According to the Ontario Living Wage Network, Halton’s living wage is estimated at $20.75/hour at a full-time job (Community Development Halton, 2021). This would translate to $3112.50/month if working 37.5 hours a week. With this in mind, approximately 30% of Burlington Food Bank clients whose primary income sources are ODSP or OW, are short over $1140 per month in providing a livable wage, and that is at the maximum amount someone might get depending on their circumstances.
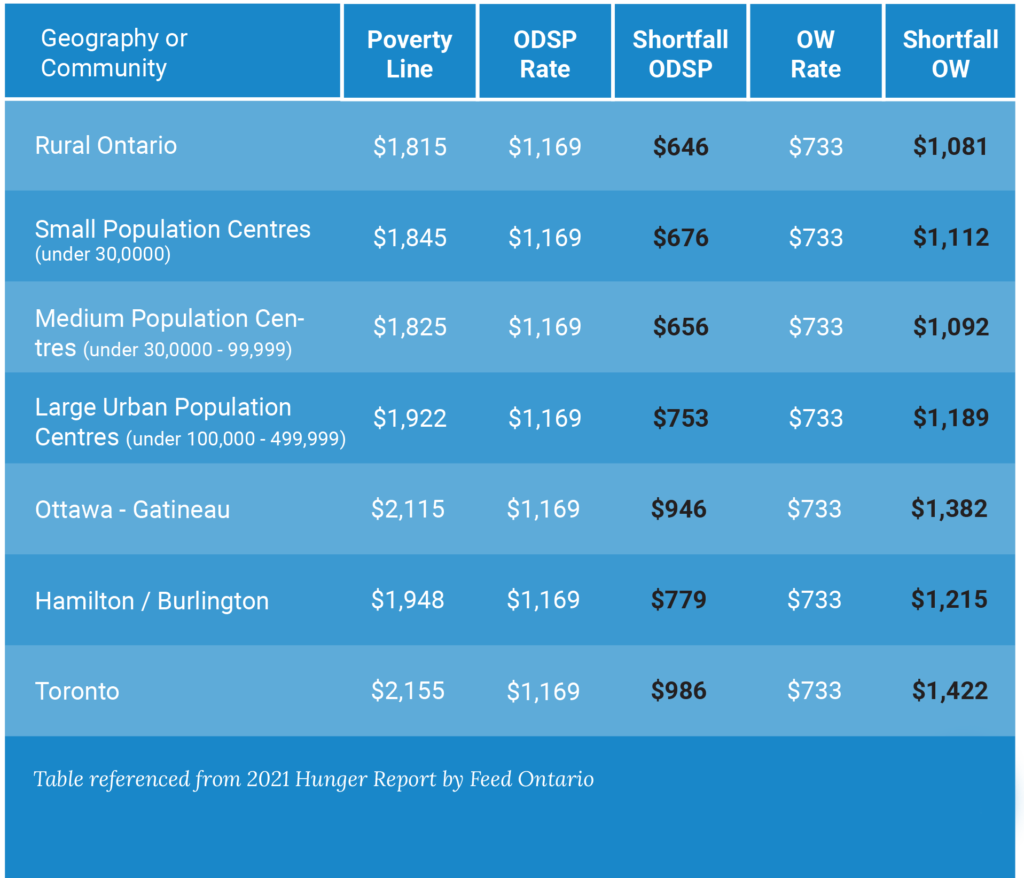
To illustrate the aforementioned troubles with low ODSP and OW rates, the 2021 Hunger Report by Feed Ontario shared the table above showing the “Poverty Line” in the second column, which is otherwise known as the “Low Income Measure” (King, Quan, Ward-Beveridge, Dixon, & Cheng, 2021). These terms are referring to the same measurement of income, which shows the lowest income a family would survive on, depending on their expenses, which is stratified by location. ODSP and OW recipients in the Hamilton/Burlington locations are significantly below the poverty line on a monthly basis.
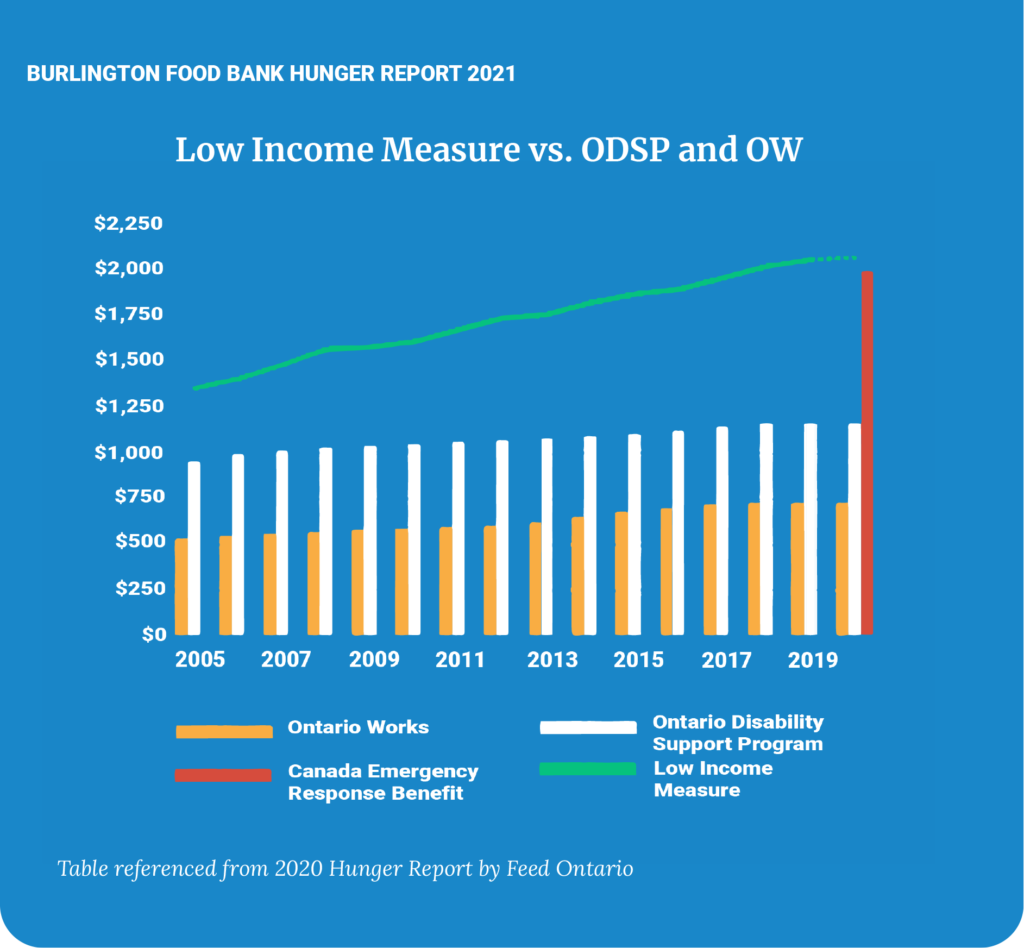
Furthermore, in the 2020 Hunger Report by Feed Ontario, a graph was shared (see below) to illustrate how far ODSP and OW fall below the Low Income Measure, and where the Canadian Emergency Response Benefit (CERB) compared to the social support systems (King & Stewart, 2020).
With the subsidies that social service recipients receive from government sources many Burlington residents struggle with their day-to-day expenses. For some, the Food Bank allows them to pay for their rent, utilities, communication, and transportation costs. This is not only true for those that receive social assistance but also for those that are in low paying jobs across several sectors including, but not limited to, the service industry, personal support workers, and many individuals just entering the workforce.
DATA TRENDS
Children Served
Questionnaire DATA TRENDS
Accessing the Food Bank - Transportation
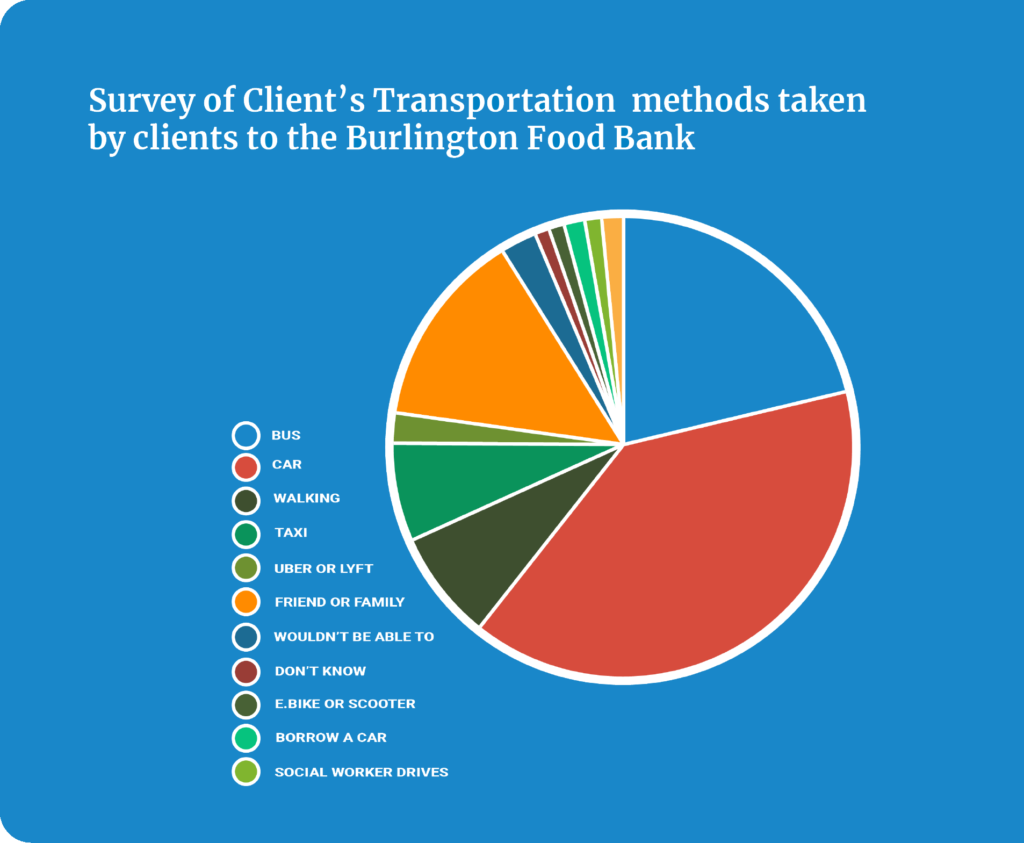
We asked clients how they would access the Food Bank, and whether they use public transportation frequently. A significant portion of respondents said they would use a car, and about 50% said they used public transportation sometimes or often. Considering these responses, we assume around 50% of clients have access to a car in some capacity. However, it is important to consider that the pandemic has reduced the frequency that people use any form of transportation. This means that public transportation use might have been more frequent prior to the start of the pandemic.
Access to a vehicle changes daily living in both positive and negative ways. Access to a personal vehicle allows for a significant decrease in travel times; along with removing the inconvenience of waiting on transit schedules or relying on others availability for a ride.
The negative impact of access to a vehicle is the increase in transportation costs taking fuel, insurance, and repairs into account. Needless to say, due to a household’s financial struggle, the inconveniences of public transportation may be worth it. However, considering that some low-income individuals are facing many small challenges in various aspects of their lives, these inconveniences all add up.
For families or individuals that do rely on public transportation, the Covid-19 pandemic and subsequent delivery service implemented by the Food Bank was in some ways a blessing as it allowed them to access services they desperately needed while having some of their ongoing barriers removed. This is something that will help the Food Bank going forward in assisting our community.
Questionnaire DATA TRENDS
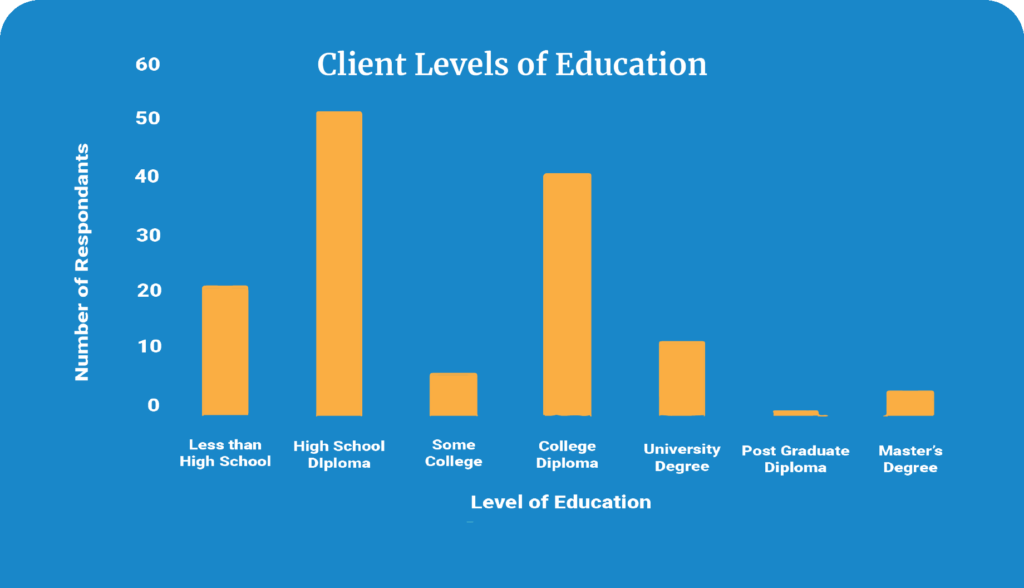
Education Level and Employment
Questionnaire DATA TRENDS
Heat, Electricity and Rent
Some of the Food Bank clients shared the sentiment included in the report saying that they prioritize having a roof over their heads and ensuring there is heat and electricity before they spend any money on food (King & Stewart, 2020).
Affordable housing is, for many households, the most significant factor that needs to be addressed. It is one of the largest drivers of people to food banks. The average rent for a one-bedroom apartment in Burlington is $1942 per month (King& Stewart, 2020).
Alarmingly, the Feed Ontario Hunger Report of 2021 notes that, “food banks saw a 23 percent increase in the proportion of homeowners accessing their services over the previous year” (King, Quan, Ward-Beveridge, Dixon, & Cheng, 2021). If individuals who are able to get a mortgage are unable to comfortably include groceries in their monthly expenses due to inflation or other increased expenditures on necessities, what does that mean going forward? The question is, will more and more homeowners require assistance?

Questionnaire DATA TRENDS
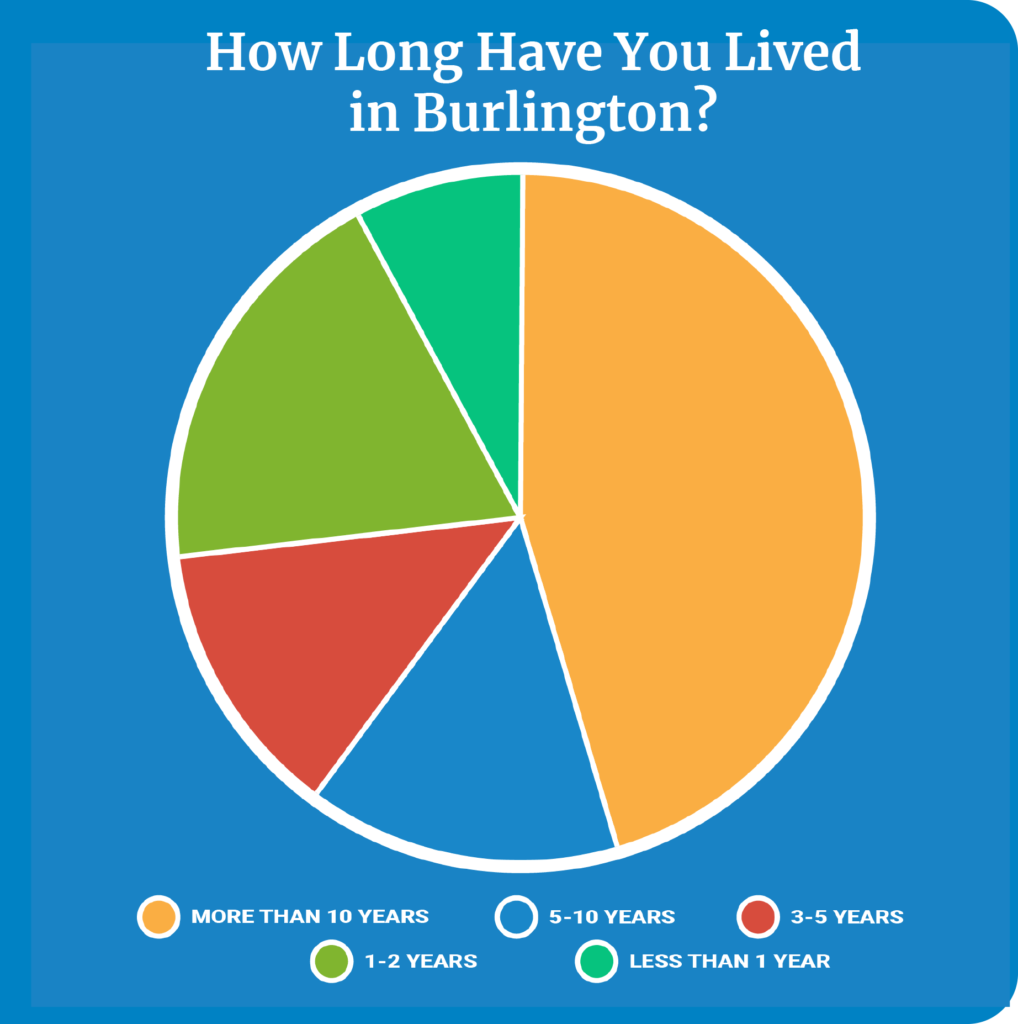
Time In Burlington
This is a clear indicator that many individuals seeking help have been here for a long time. Theoretically, clients have made their home in Burlington and as living costs have increased over time; individuals have started seeking assistance once they are unable to keep up. This is a theory and more research on how long individuals have lived here as well as how long they have sought our assistance is needed to show this.
According to Link2Feed data, only 10% of food bank users are identified as having immigrated within the last 10 years to Canada. Meanwhile, 44% of people have moved to Burlington from other areas of Canada. It could be a misinterpretation that there is a much higher number of new immigrants to Canada, when they have simply changed cities after having been citizens for 10+ years. It is important to acknowledge that many of our clients are people that have been raised here in Burlington and are still in need of assistance regardless of their background.
Conclusion
The trends demonstrated through data collected indicate that client numbers have increased significantly during the pandemic and are not reducing. If the 2008 financial crisis is any indicator, we can expect to see food bank use increase over the next couple of years here in Burlington and across the province as the financial strains continue for many households.
The lives of clients are impacted in a variety of ways, and the Burlington Food Bank offers support that assists in filling the gap left by a lack of adequate social assistance and other supports that are needed. Food banks are a system that was developed to provide emergency assistance. However, food banks are not the solution to poverty and strong policy combined with government action is required to narrow the gap between income and the cost of living (King, Quan, Ward-Beveridge, Dixon, & Cheng, 2021).
References
City of Toronto. (2018, October 01). Monthly Ontario Works Amounts. Retrieved from toronto.ca
Community Development Halton. (2021, November 03). Calculating a Living Wage for Halton – 2021 Update. Retrieved from cdhalton.ca
Government of Ontario. (2018, September). Ontario Disability Support Program – Income Support. Retrieved from mcss.gov.on.ca
Government of Ontario. (2020, November 1). Social assistance. Retrieved from ontario.ca
King, A., & Stewart, C. (2020). Hunger Report 2020 – The Impact of COVID-19 on Food Bank Use in Ontario (Rep.).
King, A., & Quan, A. (2021). Hunger Report 2021 – How the Pandemic Accelerated the Income and Affordability Crisis in Ontario (Rep.) (C. Ward-Beveridge, R. Dixon, & S. Cheng, Eds.).

